Introduction 
Oil prices spikes and growing alternative fuel use, have given rise to opportunities for new sensing technology. New fuels like ethanol, biodiesel, butanol and Fischer‐Tropsch fuel are all finding an increase in both gallons produced and the number of applications previously left to petrochemicals (1‐14). Cost pressures and the array of biofuels are generating new markets for sensors to assist in fuel blending, identifying fuel type, conversion to mass from volumetric inflow, and insuring fuel quality. Different petrochemicals and the new alternative fuels have different density values. Integrated Sensing Systems (ISS) has developed a unique fuel concentration / density sensor that can satisfy the requirements for the petrochemical and emerging alternative energy fuel market at an affordable price. This new sensor is based on a MEMS (MicroElectroMechanical Systems) sensing chip that has already been developed for the laboratory, industrial and fuel cell concentration sensing applications (15‐18). Other MEMS devices have been adapted to severe, high‐volume, relatively low cost applications in the automotive (19), consumer and medical markets so we are confident that this technology will provide both a technical and commercial solution for fuel quality, custody transfer and blending sensing applications.
| Fuel | Density Range (gm/cc) |
|---|---|
| Gasoline | 0.725-0.775 |
| E85 | 0.775-0.782 |
| Ethanol | 0.7856 |
| Butanol | 0.8095 |
| Fisher Tropsch "diesel" | 0.784-0.801 |
| Diesel | 0.822-0.860 |
| Biodiesel | 0.860-0.900 |
Alternative Energy Fuel Markets
Ethanol Market
Ethanol is the most established biofuel market, with an early start in Brazil (10) and a more recent expansion into the US (4‐9). Figure 1 shows a map of ethanol production plants in the US. Figure 2 shows how fast the US ethanol production capacity has increased between 1999 and 2007. Truly high ethanol capacity will require the development of a non‐food feedstock, which is underway. While ethanol can reduce imported oil, it does have disadvantages in lower gas mileage and contributing to the corrosion of the fuel system. To improve gas mileage ethanol is generally blended with gasoline. Ten and eighty five percent ethanol are the most common blends. As is shown in Figure 3, blending of ethanol and gasoline is already being developed to cover an even wider range of concentrations. Two tank systems one with ethanol and one with gasoline can be used to generate a wide variety of fuel blends. Corrosion issues are due ethanol’s ability to absorb and dissolve water. It is the water that leads to tank, pipeline and fuel line corrosion. This requires more expensive metals/alloys to be used in vehicles and prevents pipelines from being used to transport ethanol. Butanol (11) is an alternative to ethanol that can be distilled from the same feedstock. Butanol does not absorb water as readily as ethanol so could be transported like petrochemicals via a pipeline system. As Table 1 indicates, butanol can be distinguished from ethanol and gasoline via a density measurement.
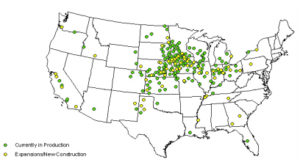
Figure 1. Ethanol production plants and those under construction, May 2008 (7).
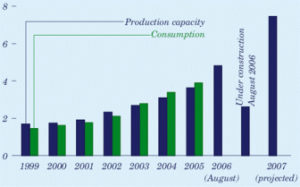
Figure 2. U.S. ethanol production and capacity 1999-2007 in billions of gallons (9).
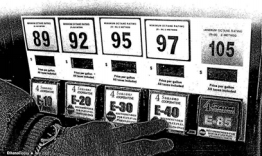
Figure 3. Blended fuel tanks: ethanol and gasoline (8).
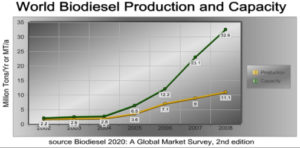
Figure 4. World biodiesel production and capacity through 2008 (12).
Biodiesel Market
The biodiesel is behind the ethanol market volume in the US, but actually is the leading biofuel market in Europe due to their higher reliance on diesel fuel. Like ethanol, biodiesel is being used in blends with petrochemicals for its initial introduction into the market place. Table 2 shows the US market for blended ethanol and biodiesel in 2005. The 5 to 20% biofuel concentration are the most common blends on the market. As Table 1 shows, biodiesel has a higher density than petrochemical diesel. Biodiesel has poorer cold temperature performance, but improved fuel lubricity and can improve exhaust emissions (20). The number of fuel filling stations and those that already accommodate biofuels are given in Table 3. The total number of filling stations in the US is 169,000. Almost 1000 stations are capable of pumping biodiesel. Table 4 gives the total number of gallons of motor fuel consumed annually in the US and what percentage in a biofuel. Ethanol is up over 2%, but biodiesel is less than a quarter of a percent of the total volume consumed. The capacity for growth clearly exists for both biofuels. Figure 4 show the world capacity for biodiesel production. As experience accumulates in this industry, larger facilities are being manufactured by a wider array of industrial. Rapid growth is projected here and abroad. Larger fuel processing capacity will drive wide use, leading to more filling stations, tanker trucks and vehicles employing biofuels.
| Fuel | Production | Motor Fuel Consumption | Blend | Current Blend Consumption |
|---|---|---|---|---|
| Ethanol | 3.9 | 136.9 | E10 | 13.70 |
| Biodiesel | 0.08 | 43.2 | B2 | 0.86 |
| B5 | 2.16 | |||
| B20 | 8.64 |
| Fuel | Number of Stations | Percent of Total |
|---|---|---|
| All Fuels | 169,000 | 100.0 |
| Biofuels | 1,767 | 1.0 |
| E85 | 799 | 0.5 |
| Biodiesel | 968 | 0.5 |
| Gasoline | Ethanol | Percent of Gasoline Pool | |
|---|---|---|---|
| 2000 | 128,662 | 1,630 | 1.27 |
| 2001 | 129,312 | 1,770 | 1.37 |
| 2002 | 132,782 | 2,130 | 1.60 |
| 2003 | 134,089 | 2,800 | 2.09 |
| 2004 | 137,022 | 3,400 | 2.48 |
| 2005 | 136,949 | 3,904 | 2.85 |
| Diesel | Biodiesel | Percent of Diesel Fuel Pool | |
|---|---|---|---|
| 2000 | 37,238 | ----- | ----- |
| 2001 | 38,155 | 9 | 0.02 |
| 2002 | 38,881 | 11 | 0.03 |
| 2003 | 40,856 | 18 | 0.04 |
| 2004 | 42,773 | 28 | 0.07 |
| 2005 | 43,180 | 91 | 0.21 |
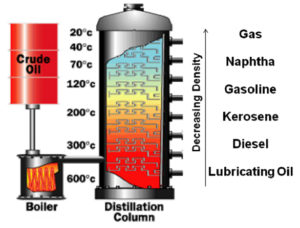
Figure 5. The petrochemical and density change along a distillation column.
Fisher‐Tropsch
Fuel solution to the US dependence on Middle Eastern oil imports is the development of Fisher‐Tropsch (FT) fuels. These liquid fuels are produced from th import A potential long term hydrocarbon feedstock like coal, natural gas or oil shale. Due to higher processing costs, the development and use of Fisher‐Tropsch fuel has to date been limited to countries wi barriers for petrochemicals such as South Africa during apartheid and Germany during World War II, or an excess of natural gas resources such as modern Malaysia (1). The US military has taken the lead in this area with a long term goal on replacing 75% of the oil imports by 2025 (1,2). These reserves offer the equivalent oil reserve of 2.3 trillion barrels, more than three times the Middle East oil reserves. The main measurable difference between Fisher‐Tropsch fuel and petrochemical fuel is density. As Table 1 showed, FT fuel can be distinguished from petrochemical diesel fuel and biodiesel by density. The US military is introducing this fuel into military aviation and trucking, commercial aviation and trucking will follow with automotive applications being the last adopter of this alternative fuel.
Petrochemical Market
The majority of the existing fuel applications are with petrochemicals. Density goes down as you move up the distillation column as illustrated in Figure 5. Petrochemicals are already blended with each other to produce different grades of gasoline and diesel fuels. They are also blended with biofuels like ethanol and biodiesel. Density measurement of aviation is critical for custody transfer. Oil companies sell fuel volumetrically, while aircraft use mass‐ based measurement. Fuel temperature and blend quality causes the density to change which affects the fuel mass delivered to aircraft and in many cases can put the airlines at a cost disadvantage, particularly in hot conditions.
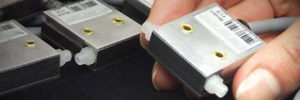
Figure 6. The ISS FC‐6 density and chemical concentration sensor.
ISS Density Sensors
ISS has developed a unique fluid density sensor based on its patented micromachined density and flow sensor technology. ISS began selling density and concentration meters using this MEMS‐based technology in 2003 (15,16). This sensing approach uses a small, hollow silicon microtube. This small tube vibrates at a given frequency, as the density or concentration of the liquid in the tube changes the vibration frequency will change. The ISS model FC6 in‐ line density meter and Fuel Cell sensor, shown in Figure 6, was first applied to measuring methanol concentration in a DMFC system. This new sensor provides a needed device for the Direct Methanol Fuel Cell (DMFC) market (21,22). Without an accurate methanol concentration sensor, active DMFCs cannot perform efficiently.
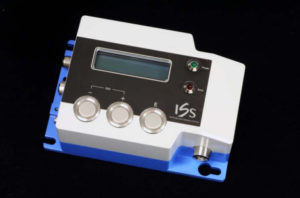
Figure 7. The intrinsically safe ISDM-10 density sensor.
The sensing concept is universal for virtually any fluid or liquid solution. The density of the fluid (liquid or gas) can be measured using the vibrational frequency of the microtube. For binary solutions this has been used with methanol and ethanol, fuel cells to measure concentration. Petrochemicals and biofuels can use the density or API output to indicate the type of fuel, its purity and to blend fuels together. Fig 7 shows an intrinsically safe density sensor designed by ISS. The ISDM‐10 can be used with all types of liquid fuels and fuel blends. There are no other products on the market that can accurately identify fuel type, sense fuel concentration for blending over a wide temperature and concentration range and in the presence of chemical impurities for the size and cost the ISS device can achieve. ISS’ proprietary, patented MEMS‐based technologies are the key to making this type of device possible.
ISS MEMS Senor Technology
The ISS resonant microtubes employ a MEMS fabrication process, which uses a combination of plasma and wet etching, photolithography, along with w bonding to form their microfluidic chips (15). Figure 8 shows an uncapped microtube resonator chip. The silicon tube shown in Figure 8, is anodically bonded to glass. This glass wafer has the metal electrodes and runners used to carry electrical signals. The metal layer is also used as an on‐chip, resistive temperature sensor. Two holes in the bottom glass chip admit fluid into and out of the silicon microtube.
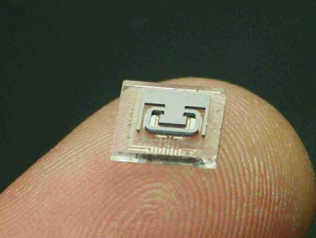
Figure 8. A decapped, MEMS chip, on a finger tip, showing the microtube and metal pattern.
The MEMS chip requires electronics to amplify the signal and drive the microtube into resonance, in addition the signal is processed to obtain a methanol concentration value. The tube is driven into resonance electrostatically and its motion sensed capacitively using metal electrodes under the tube and accompanying electronic circuits connected to the MEMS chip via wire bonding.
ISS Sensor Performance Results
The density of any fluid varies with temperature. For example, the characterization of methanol to water concentration over temperature is key to arriving at an accurate methanol concentration value. Figure 9 shows how the density of diesel fuel varies over temperature. Similar relationship exist for different fuels.
A variety of fuels can employ density and flow sensors. Table 1 shows how the density of various biofuels and petrochemicals compare. Density can be used as an effective fuel identifier and for blending purposes. Figure 9 shows how diesel fuel density varies with temperature. Figure 10 and 11 show how the concentration of water or gasoline in ethanol can be measured using density.
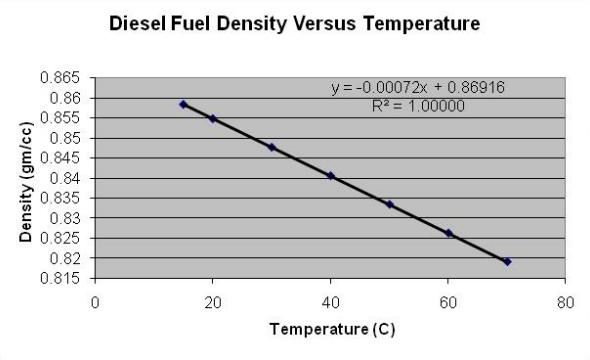
Figure 9. The variation in density of diesel fuel over temperature.
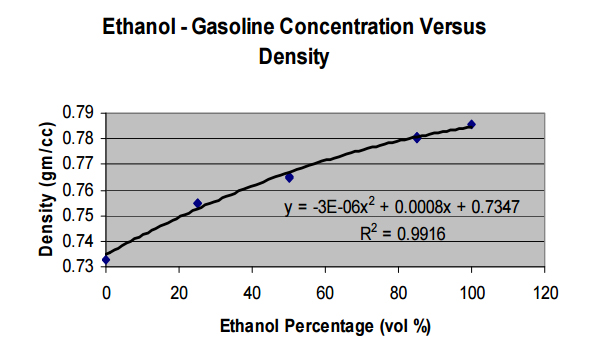
Figure 10. A density versus concentration plot for ethanol and water, data taken with the ISS MEMS sensor (16).
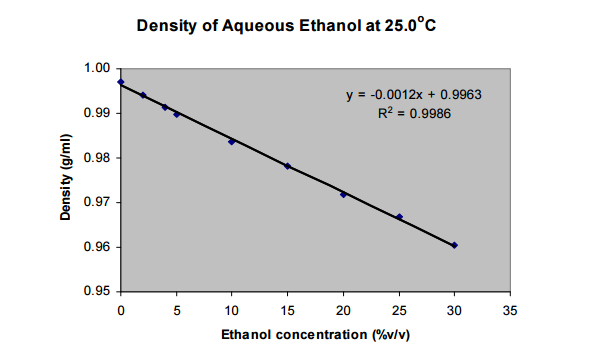
Figure 11. The density plot for ethanol‐gasoline at 25°C.
Table 5. shows that density can also be used to detect water and air bubbles in a liquid and can be used to monitor the quality of antifreeze and hydraulic fluid. Water contamination can be a problem with pipe transport and tank storage. Trapped water at the bottom of a fuel tank can be detected via density.
| Fluid (15.55 ℃) | Density (gm/cc) |
|---|---|
| Coolant / Antifreeze | 1.12622 |
| Water | 0.99904 |
| Hydraulic Fluid | 0.87058 |
| Kerosene | 0.85450 |
| Diesel Fuel | 0.82258 |
| Methanol | 0.79592 |
| Air | 0.00122 |
Comparisons to Steel Coriolis Mass Flow and Density Meters
Stainless steel resonating Coriolis mass flow meters and density meters are made by a variety of manufacturers, shown in Figure 12. Price, size and weight are the main force preventing these devices from wider use. These large industrial sensors sell for $3,500 to more than $20,00 (23-25). A MEMS chip-based sensor has a significant cost and size advantage over the larger hand assembled steel tube flow and density sensors.
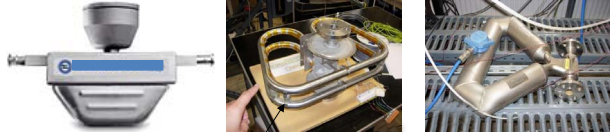
Figure 12. Examples of stainless steel tube Coriolis mass flow / density meters (23‐25).
Since all Coriolis mass flow and density meters are vibratory devices, vibration sensitivity has been underlying problem with this technology. This is a critical problem for industrial, automotive and aerospace applications where shock and vibration are common place. Conventional metal tube Coriolis mass flow meters resonate at 100 to 1500 Hz (24,25), leaving them susceptible to the spectrum of common external mechanical vibration and shock frequencies which are under 2000Hz.
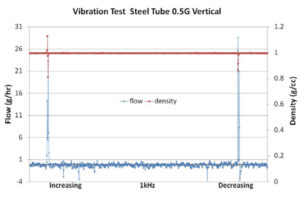
Figure 13. Flow and density errors in stainless steel tube Coriolis meters under vibration.
To examine the difference between the MEMS sensor in this study and a conventional steel tube and MEMS‐based Coriolis mass flow sensor both were placed on a vibratory test stand and cycled from 10 Hz to 1000Hz starting at 0.5g and going to 2g acceleration while monitoring the zero flow rate output of a water filled tube. Figure 13 shows that the conventional steel Coriolis meter had both large flow and density output spikes at its resonance frequency at very low accelerations, 0.5g. The silicon tube used in the MEMS sensor in this study has resonant frequencies ranging from 20KHz to 30KHz, well above what is typically experienced in an industrial, automotive or aerospace applications. The zero flow rate output of the MEMS tube was within a +/‐ 1 g/hr band at all external vibrational frequencies at 2 g. The density output of the MEMS sensor was not affected by vibration. This is an advantage for the MEMS‐based Coriolis mass flow and density meters over conventional steel tube technology and can broaden the field of use to include applications with significant vibration and shock like the trucking and aerospace markets.
Conclusions
ISS is marketing new density and chemical concentration measurement technology that opens up capabilities for the fuel quality, custody transfer and blending markets. Petrochemicals, fuels, biofuels can be monitored for concentration, purity, water content and grade using density. Operating on the same principle as conventional steel Coriolis meters, the ISS sensing element is small enough to fit on your finger tip. This size advantage and its associated cost savings enables this sensing capability to be distributed across new areas in fuel and chemical management.